GnuPlotPlugin
Syntax Rules
- Just add
%GNUPLOT{"PlotName"}%anywhere in the page where you want the plot to appear and save the topic - Multiple plots can be displayed within one topic
- Any CSV (Comma Seperated Variable) file attached to the topic can be used with the plot or splot commands
Examples
The following images are examples of plots generated by GnuPlot:Simple function test
Pre-rendered sample (TestInstall):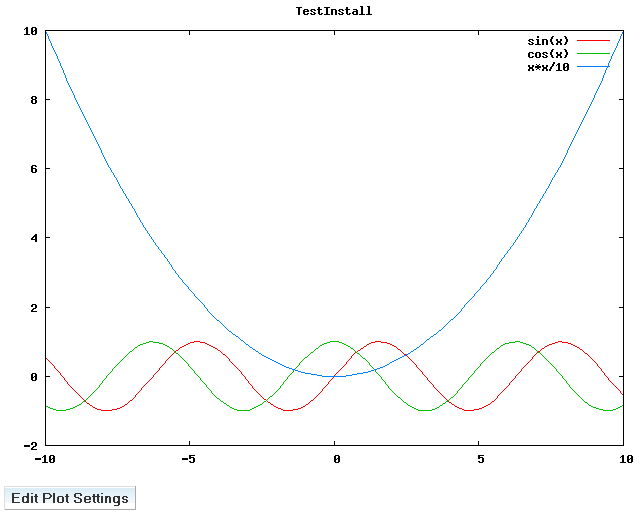
|
Plugin (TestInstall): %GNUPLOT{"TestInstall"}% |
Verbatim (TestInstall):
%GNUPLOT{"TestInstall"}%

Plot settings:
set title "TestInstall"
set datafile separator ","
set terminal png
plot sin(x), cos(x), x*x/10
|
Multi graphs with errorbars, datafile based
Pre-rendered sample (MultigraphWithErrorbars):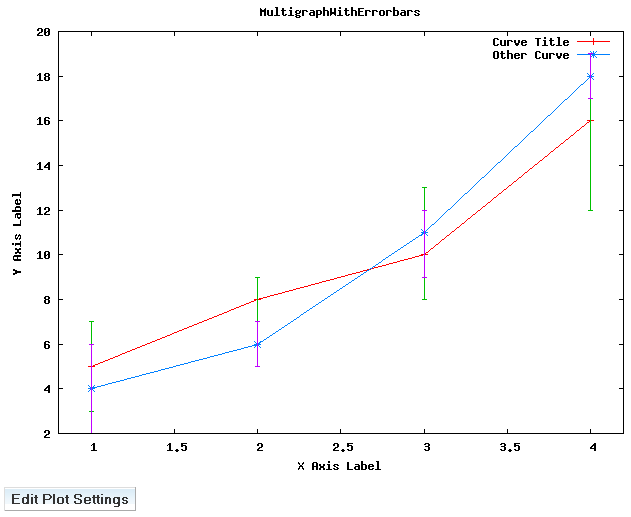
|
Plugin (MultigraphWithErrorbars): %GNUPLOT{"MultigraphWithErrorbars"}% |
Verbatim (MultigraphWithErrorbars):
%GNUPLOT{"MultigraphWithErrorbars"}%

Plot settings:
set title "MultigraphWithErrorbars"
set xlabel "X Axis Label"
set ylabel "Y Axis Label"
set term gif
set data style lp
set terminal png
plot [.8:4.2] "MultigraphWithErrorbarsData.data" using 1:2 t "Curve Title", \
"MultigraphWithErrorbarsData.data" using 1:2:3:4 notitle with errorbars ps 0, \
"MultigraphWithErrorbarsData.data" using 1:5 t "Other Curve", \
"MultigraphWithErrorbarsData.data" using 1:5:6:7 notitle with errorbars ps 0
|
Damped sinus, datafile based
Pre-rendered sample (DampedSinus):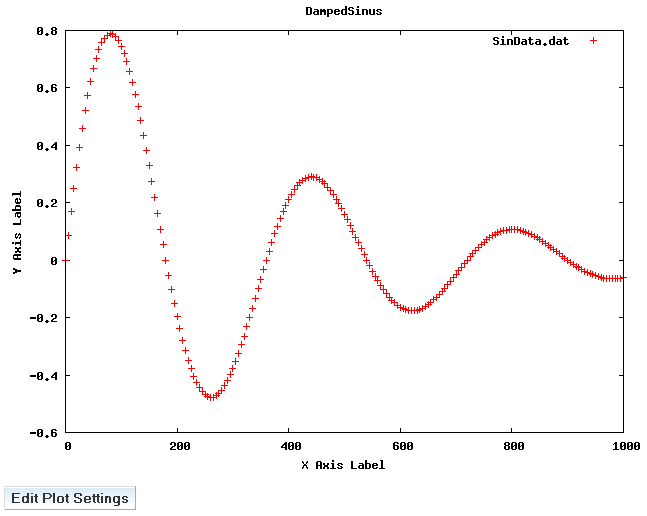
|
Plugin (DampedSinus): %GNUPLOT{"DampedSinus"}% |
Verbatim (DampedSinus):
%GNUPLOT{"DampedSinus"}%

Plot settings:
set title "DampedSinus"
set xlabel "X Axis Label"
set ylabel "Y Axis Label"
set terminal png
plot 'DampedSinusData.data'
|
Map of Denmark, datafile based (data from CIA World Data Bank II)
Pre-rendered sample (CIAWorldDataBankIIDenmark):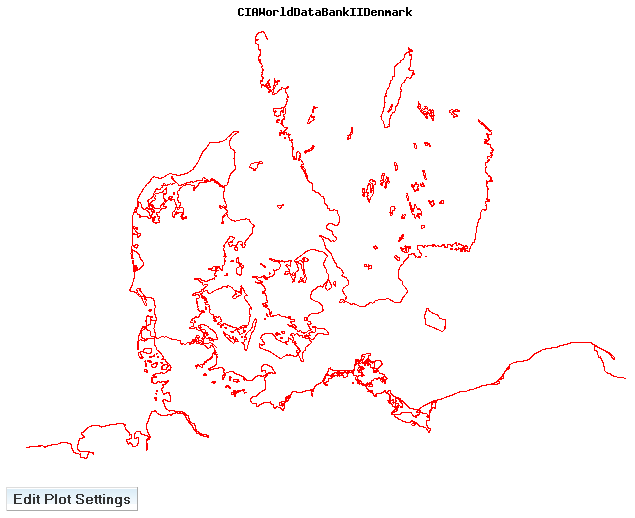
|
Plugin (CIAWorldDataBankIIDenmark): %GNUPLOT{"CIAWorldDataBankIIDenmark"}% |
Verbatim (CIAWorldDataBankIIDenmark):
%GNUPLOT{"CIAWorldDataBankIIDenmark"}%

Plot settings:
set title "CIAWorldDataBankIIDenmark"
set noxtics
set noytics
set noborder
set data style dots
set terminal png
plot "CIAWorldDataBankIIDenmarkData.data" title "" with lines
|
Interlocking Tori (3D)
Pre-rendered sample (InterlockingTori):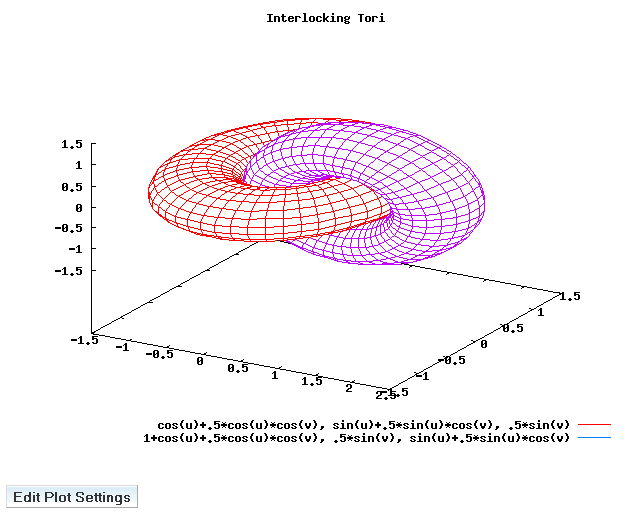
|
Plugin (InterlockingTori): %GNUPLOT{"InterlockingTori"}% |
Verbatim (InterlockingTori):
%GNUPLOT{"InterlockingTori"}%

Plot settings:
set parametric
set isosamples 50,10
set hidden
set title "Interlocking Tori"
set key below
set urange [-pi:pi]
set vrange [-pi:pi]
set isosamples 50,20
set terminal png
splot cos(u)+.5*cos(u)*cos(v),sin(u)+.5*sin(u)*cos(v),.5*sin(v) with lines, 1+cos(u)+.5*cos(u)*cos(v),.5*sin(v),sin(u)+.5*sin(u)*cos(v) with lines
|
Blue Whale (3D), datafile based
Pre-rendered sample (BlueWhale):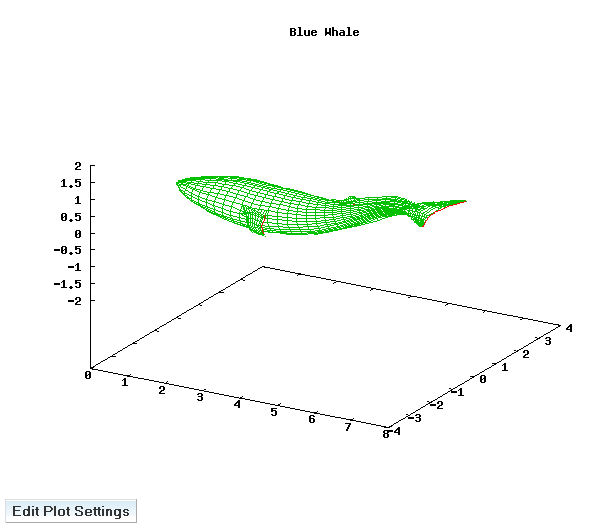
|
Plugin (BlueWhale): %GNUPLOT{"BlueWhale"}% |
Verbatim (BlueWhale):
%GNUPLOT{"BlueWhale"}%

Plot settings:
set parametric
set hidden3d
set nokey
set xrange [0:8]
set yrange [-4:4]
set zrange [-2:2]
set data style line
set title "Blue Whale"
set terminal png
splot "whale.dat"
|
Alternative GnuPlot render sizes, Rosenbrock Function
This one is shown in 350x280. Try blowing it up in size - alter theset terminal png size 350,280 line into something larger (i.e. 1000,1000).
Pre-rendered sample (RosenbrockFunction):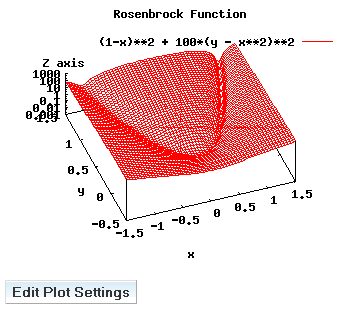
|
Plugin (RosenbrockFunction): %GNUPLOT{"RosenbrockFunction"}% |
Verbatim (RosenbrockFunction):
%GNUPLOT{"RosenbrockFunction"}%

Plot settings:
set logscale z 10
set view 20, 340, 1, 1
set isosamples 60, 60
set hidden3d offset 1 trianglepattern 3 undefined 1 altdiagonal bentover
set style data lines
set ticslevel 0
set title "Rosenbrock Function" 0.000000,0.000000  font ""
set xlabel "x" -5.000000,-2.000000  font ""
set xrange [ * : * ] noreverse nowriteback  # (currently [0.00000:15.0000] )
set ylabel "y" 4.000000,-1.000000  font ""
set yrange [ * : * ] noreverse nowriteback  # (currently [0.00000:15.0000] )
set zlabel "Z axis" 0.000000,0.000000  font ""
set zrange [ * : * ] noreverse nowriteback  # (currently [-1.20000:1.20000] )
set terminal png size 350,280
splot [-1.5:1.5] [-0.5:1.5] (1-x)**2 + 100*(y - x**2)**2
|
Plugin Settings
- One line description, is shown in the TextFormattingRules topic:
- Set SHORTDESCRIPTION = Allows users to plot data and functions using GnuPlot
- Debug plugin: (See output in
data/debug.txt)- Set DEBUG = 0
Plugin Installation Instructions
Note: You do not need to install anything on the browser to use this plugin. The following instructions are for the administrator who installs the plugin on the TWiki server.- For an automated installation, run the configure script and follow "Find More Extensions" in the in the Extensions section.
- Or, follow these manual installation steps:
- Download the ZIP file from the Plugins home (see below).
- Unzip
GnuPlotPlugin.zipin your twiki installation directory. Content:File: 
Description: data/TWiki/GnuPlotHelp.txtHelp topic data/TWiki/GnuPlotPlugin.txtPlugin topic lib/TWiki/Plugins/GnuPlotPlugin.pmPlugin Perl module lib/TWiki/Plugins/GnuPlotPlugin/Plot.pmPerl module responsible for rendering the plot area lib/TWiki/Plugins/GnuPlotPlugin/PlotSettings.pmPerl module responsible for managing the settings pub/TWiki/GnuPlotHelp/gnuplot.htmlHTML file pub/TWiki/GnuPlotPlugin/*Sample plot data files tools/gnuplot.plHelper Perl script - Set the ownership of the extracted directories and files to the webserver user.
- Plugin configuration and testing:
- Run the configure script and enable the plugin in the Plugins section.
- In
lib/TWiki/Plugins/GnuPlotPlugin/Plot.pmlook for the following line and update the paths to fit your environment:
# Update $gnuplotPath, $gnuplotHelperPath and $execCmd to fit your environment - Test if the installation was successful: See examples above
Planned improvements
- TWiki compatible syntax for using datafiles from any topic.
- Form based editing of plot settings to make it easier for users that are not familiar with GnuPlot
Plugin Info
| Plugin Author: | TWiki:Main.AbieSwanepoel |
| Copyright: | © 2006 TWiki:Main.AbieSwanepoel © 2008-2011 TWiki:TWiki.TWikiContributor |
| License: | GPL (GNU General Public License |
| Plugin Version: | 2011-03-12 |
| Change History: | |
| 2011-03-12: | TWikibug:Item6638 |
| 2006-04-30: | Added sandbox security mechanism -- TWiki:Main.SteffenPoulsen |
| 2006-04-19: | Fixed anchors, added 3D examples, added png size option -- TWiki:Main.SteffenPoulsen |
| 2006-04-17: | Doc update, changed working dir to ATTACHURLPATH -- TWiki:Main.SteffenPoulsen |
| 2006-01-27: | Initial version |
| TWiki Dependency: | $TWiki::Plugins::VERSION 1.1 |
| CPAN Dependencies: | none |
| Other Dependencies: | GnuPlot (available from http://www.gnuplot.info |
| Perl Version: | 5.005 |
| Benchmarks |
GoodStyle 100%, FormattedSearch 100%, GnuPlotPlugin 100% |
| Plugin Home: | http://TWiki.org/cgi-bin/view/Plugins/GnuPlotPlugin |
| Feedback: | http://TWiki.org/cgi-bin/view/Plugins/GnuPlotPluginDev |
| Appraisal: | http://TWiki.org/cgi-bin/view/Plugins/GnuPlotPluginAppraisal |
Topic revision: r0 - 2011-03-13 - TWikiContributor


Ideas, requests, problems regarding TWiki? Send feedback
Note: Please contribute updates to this topic on TWiki.org at TWiki:TWiki.GnuPlotPlugin.