Computation of Limits with Theta
Here I compute limits for i2HDM signal with
Theta package
.
List of MC samples for signal (i2HDM)
The following table shows the details of MC samples for i2HDM signal, as the number of generated events and the cross section with correspondent λ
345. We consider the cases of
h1h1 DM production for 8 and 13 TeV.
Benchmark |
Mh1 |
Number of generated events (from LHE) |
Cross Section (λ345) (pb) |
| (h1h1) DM production (8 TeV) |
| (h1h1) NEW DM production (13 TeV) |
| (h1h1) NEW DM production (8 TeV) |
| BM1 |
45 |
50000 |
0.17 (-0.010) |
| BM2 |
53 |
50000 |
0.77 (-0.024) |
| BM3 |
66 |
50000 |
0.000043 (+0.022) |
| BM4 |
82 |
50000 |
0.00012 (-0.090) |
| BM5 |
120 |
50000 |
0.000023 (-0.100) |
| |
40 |
100000 |
0.073899 (0.01) |
| |
41 |
100000 |
0.072681 (0.01) |
| |
42 |
100000 |
0.071266 (0.01) |
| |
43 |
100000 |
0.070021 (0.01) |
| |
44 |
100000 |
0.068574 (0.01) |
| |
45 |
100000 |
0.067103 (0.01) |
| |
46 |
100000 |
0.065719 (0.01) |
| |
47 |
100000 |
0.064175 (0.01) |
| |
48 |
100000 |
0.062273 (0.01) |
| |
49 |
100000 |
0.06049 (0.01) |
| |
50 |
100000 |
0.058593 (0.01) |
| |
51 |
100000 |
0.056552 (0.01) |
| |
52 |
100000 |
0.054462 (0.01) |
| |
53 |
100000 |
0.052094 (0.01) |
| |
54 |
100000 |
0.049695 (0.01) |
| |
55 |
100000 |
0.04703 (0.01) |
| |
56 |
100000 |
0.04403 (0.01) |
| |
57 |
100000 |
0.040899 (0.01) |
| |
58 |
100000 |
0.037309 (0.01) |
| |
59 |
100000 |
0.033193 (0.01) |
| |
60 |
100000 |
0.028262 (0.01) |
| |
61 |
100000 |
0.022176 (0.01) |
| |
62 |
100000 |
0.012981 (0.01) |
| |
40 |
100000 |
0.24281 (0.01) |
| |
41 |
100000 |
0.23912 (0.01) |
| |
42 |
100000 |
0.23478 (0.01) |
| |
43 |
100000 |
0.23028 (0.01) |
| |
44 |
100000 |
0.22542 (0.01) |
| |
45 |
100000 |
0.22092 (0.01) |
| |
46 |
100000 |
0.21604 (0.01) |
| |
47 |
100000 |
0.21040 (0.01) |
| |
48 |
100000 |
0.20503 (0.01) |
| |
49 |
100000 |
0.19892 (0.01) |
| |
50 |
100000 |
0.19255 (0.01) |
| |
51 |
100000 |
0.18638 (0.01) |
| |
52 |
100000 |
0.17927 (0.01) |
| |
53 |
100000 |
0.17154 (0.01) |
| |
54 |
100000 |
0.16370 (0.01) |
| |
55 |
100000 |
0.15431 (0.01) |
| |
56 |
100000 |
0.14503 (0.01) |
| |
57 |
100000 |
0.13431 (0.01) |
| |
58 |
100000 |
0.12249 (0.01) |
| |
59 |
100000 |
0.10901 (0.01) |
| |
60 |
100000 |
0.093206 (0.01) |
| |
61 |
100000 |
0.072845 (0.01) |
| |
62 |
100000 |
0.042620 (0.01) |
Distributions
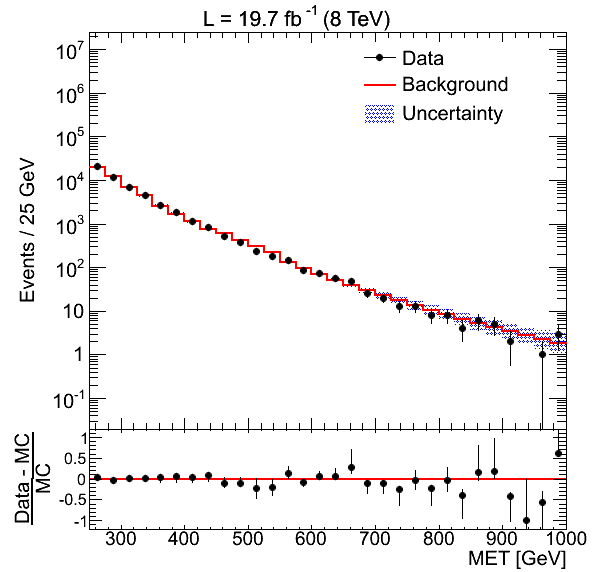
The figure below shows MET distributions (8 TeV) from
CMS-EXO-12-048.

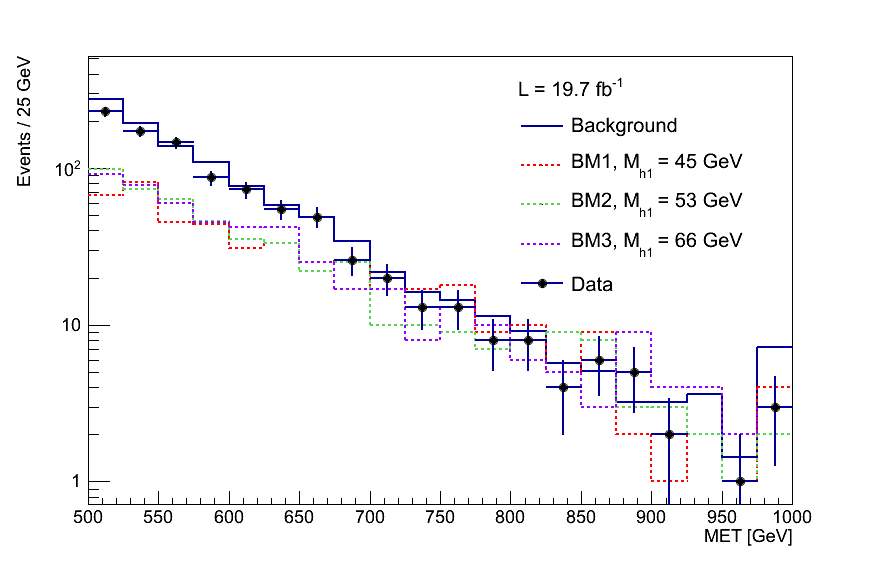
The figure below shows data and background MET distributions (8 TeV) "stolen" from
CMS-EXO-12-048 compared with
h1h1 from i2HDM DM signal. The DM signal comes directly from LHE level. Here we consider the following cuts on that CMS paper:
- pT(Jet1) > 110 GeV
- |η(Jet1)| < 2.4
- MET > 500 GeV
- Additionally, for studies that take into account effects of showering // hadronization // detector response, there are additional selections on the full set of jets attending the requirements pT(Jet1) > 30 GeV and |η(Jet1)| < 4.5:
- If there are three or more such jets in the event: discard the event.
- If there are exactly two of those jets (J1, J2n the event, AND their azimuthal distance (&Delta&phi(J1, J2)) is larger than 2.5: discard the event.
Computing Limits
Here we use
Theta package to compute the limits.
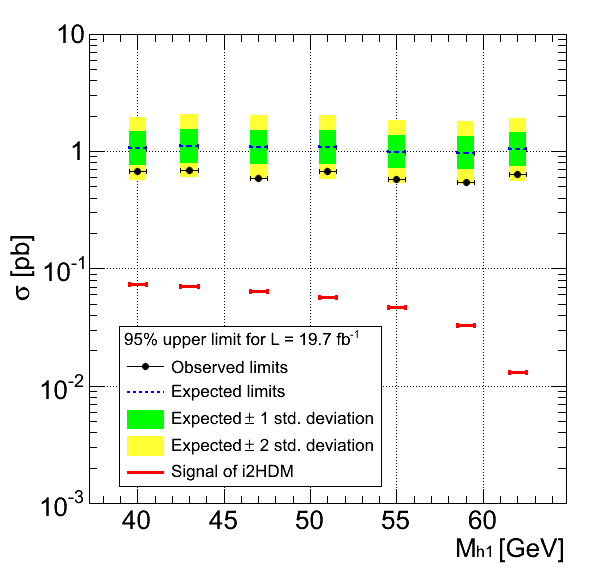
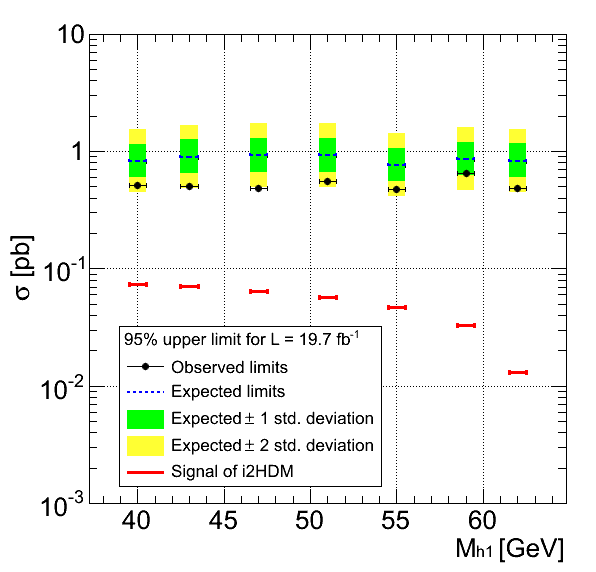
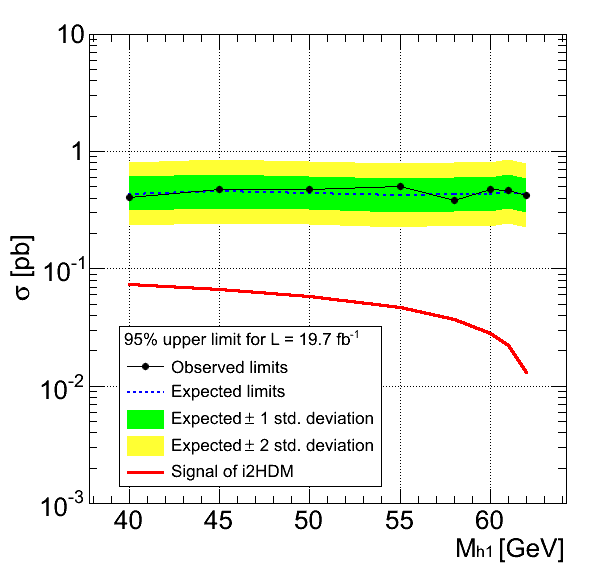
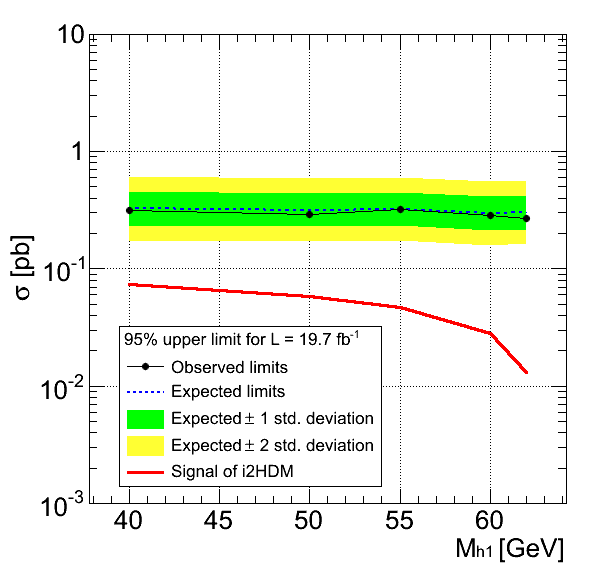
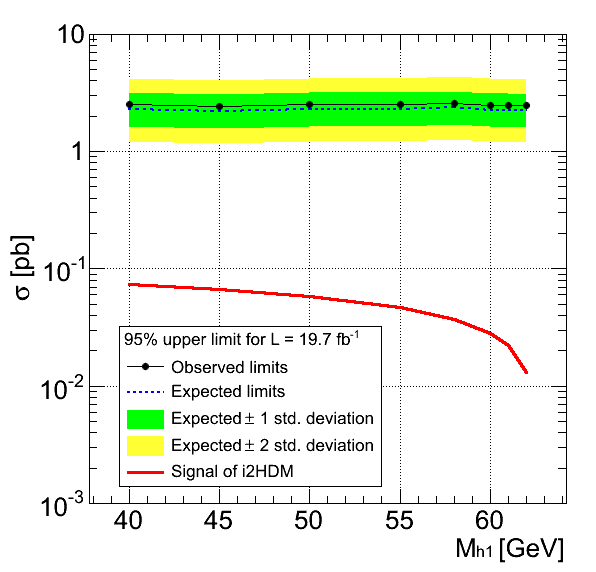
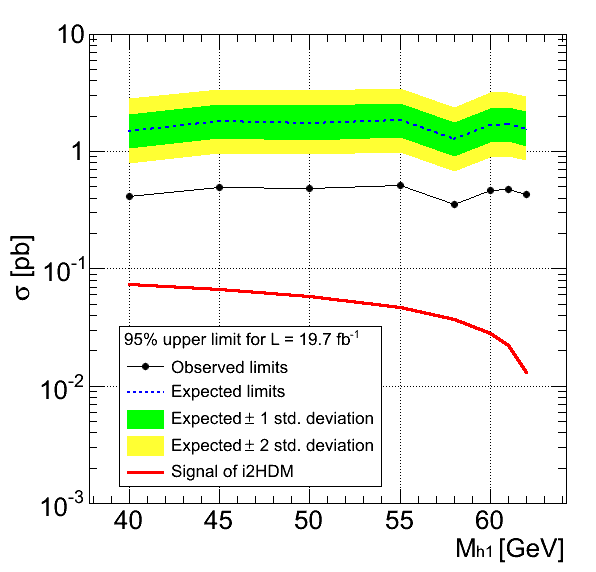
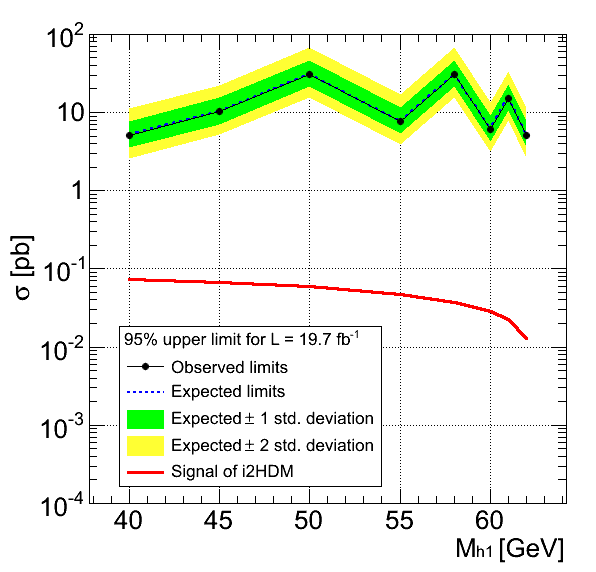
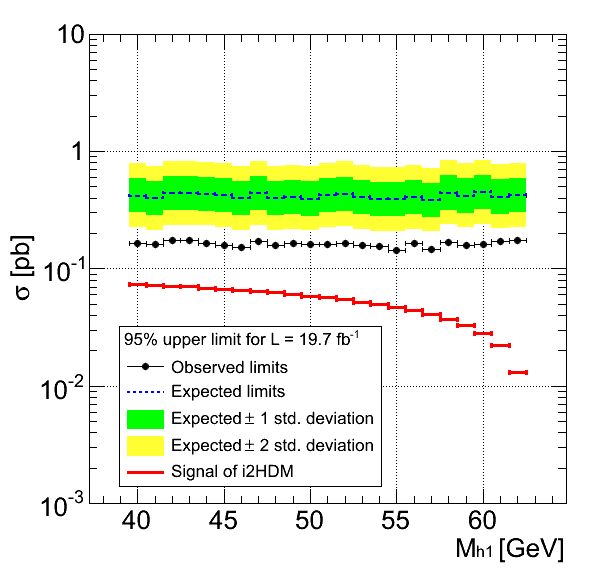
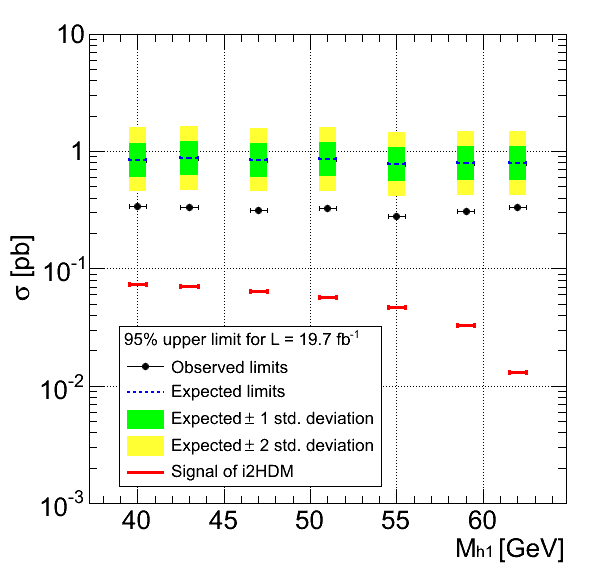
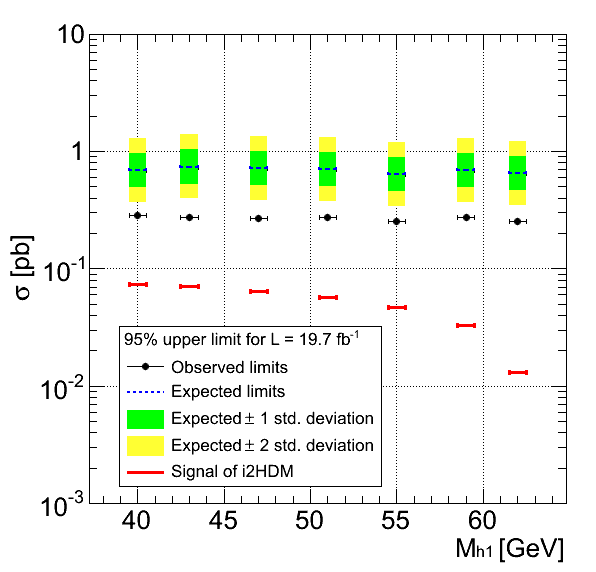
Generator Level
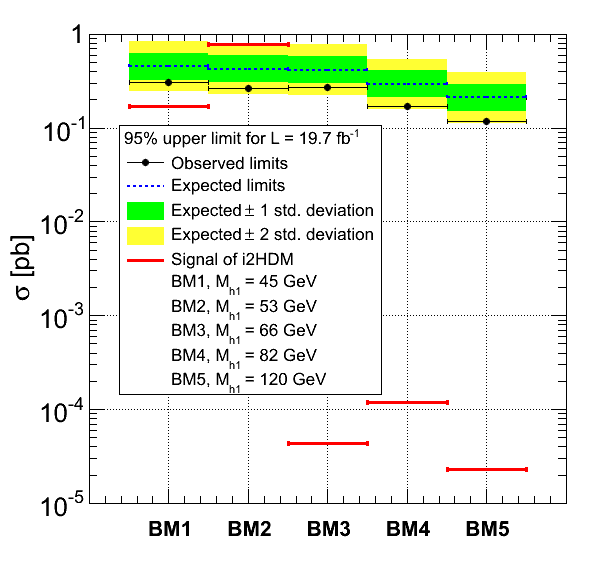
The figure below shows the observed and expected limits (8 TeV) for signal in generator level, as well as the correspondent signal cross sections (for different λ
345). Here we have the peace of code used to get the limits:
model = build_model_from_rootfile(['EXO-12-048_data.root','background.root','i2hdm_BM4_h1h1j_8tev-single-THETA.root'])
#print model

model.set_signal_processes('i2HDMBenchmark*')
model.scale_predictions(0.06698,procname="i2HDMBenchmark1",obsname="CMS_EXO_12_048")
#model.scale_predictions(0.30338,procname="i2HDMBenchmark2",obsname="CMS_EXO_12_048")
#model.scale_predictions(0.000017,procname="i2HDMBenchmark3",obsname="CMS_EXO_12_048")
#model.scale_predictions(0.000047,procname="i2HDMBenchmark4",obsname="CMS_EXO_12_048")
#model.scale_predictions(0.000009,procname="i2HDMBenchmark5",obsname="CMS_EXO_12_048")

expected, observed = asymptotic_cls_limits(model)

print expected, observed

report.write_html('htmlout')
Since we have less data than background, the observed limits are below the expected ones. Despite the fact that data and background does not change,
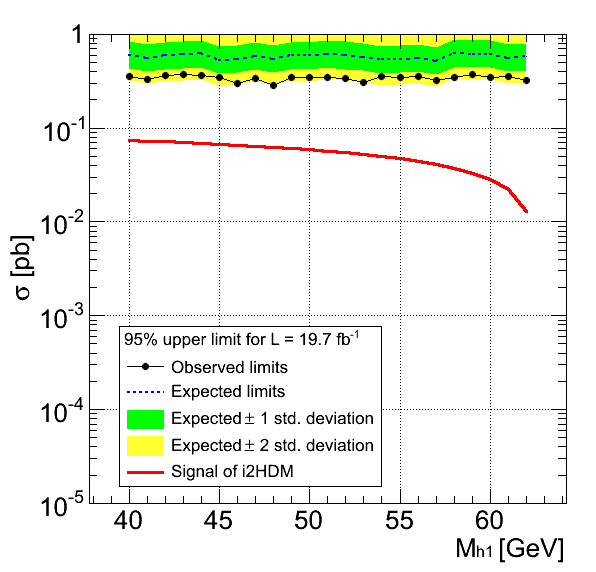
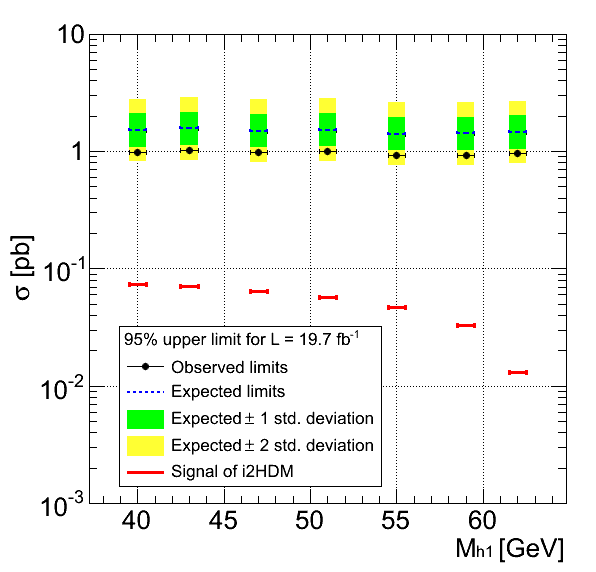
observed and expected limits change because signal samples have different efficiencies. The plots show limits in generator level (4-vector information from LHE files) for:
- benchmarks (left);
- and new LHE files with jet pt QCD scale (right) according cross sections from tables above.
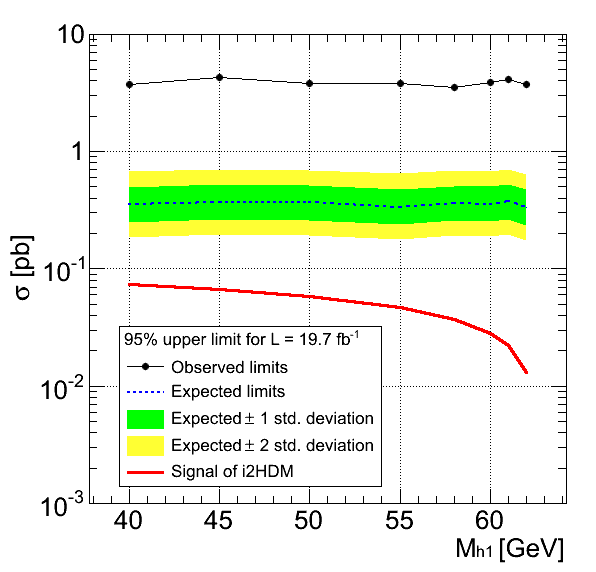
Signal with hadronization
The plots bellow show limits for signal (using data and background from 8 TeV) after hadronization via
Pythia+Delphes. These limits were computed using:
- 1 bin histogram (left); and
- and shape analysis (right).
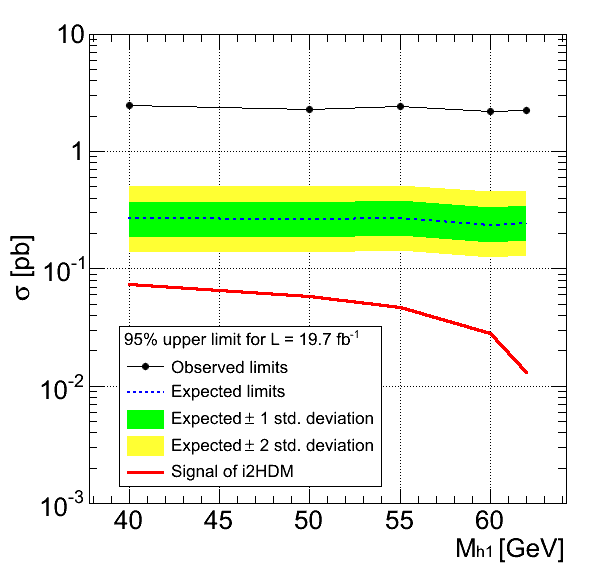
The plots bellow compare limits for signal (using data and background from 8 TeV) after hadronization via:
- Pythia only (left); and
- Pythia+Delphes (right).
Both limits are based on shape analysis. It seems that hadronization using
Pythia only has an improvement from 10 to 20%.
The plots bellow show the limits after relaxing the MET selection to MET > 250 GeV in case of
Pythia+Delphes. We use signal with:
- jet pt scale (left); and
- DM mass scale (right).
The disagreement between observed and expected limits are directly related to the excess of data in MET distribution above, which explains the selection in MET = 500 GeV.
Limits after histograms correction
Data and background distributions were corrected (bin-by-bin) in order to have the same number of events as in table 3 of CMS-EXO-12-048. These is the data and background MET distribution after correction:
The limits bellow are based on hadronization via
Pythia+Delphes using
- jet pt scale (left); and
- DM mass scale (right).
The limits bellow take into account only 2 bins of the MET distribution in the following way
- 250 < MET < 300 GeV (left)
- 500 < MET < 550 GeV (middle)
- 950 < MET < 1000 GeV (right)
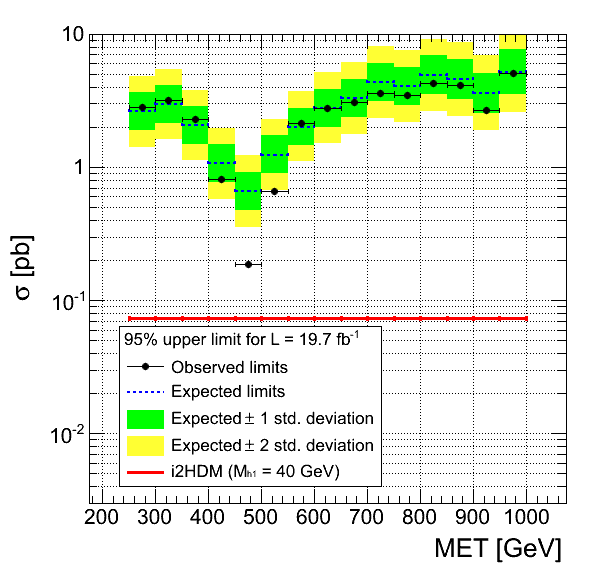
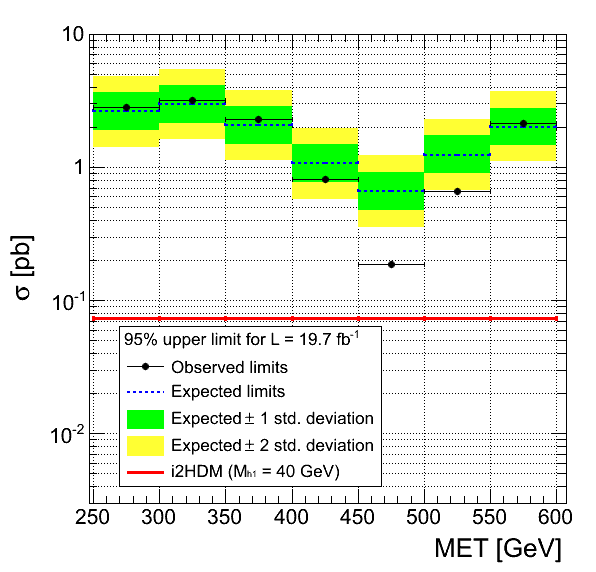
Bellow we have limits based on 1 bin in the MET distribution as done in fig. 4 of CMS paper
CMS-EXO-12-048:
- 250 < MET < 1000 GeV (left); and
- 250 < MET < 600 GeV (to compare with fig. 4 in the CMS paper) (right).
In all cases, only a lower cut in MET is taken into account. The upper MET value is always 1000 GeV. The disagreement in the range 450 < MET < 550 GeV is related to the fact that our histograms contains Data much lower than background in this region (even considering the background uncertainty).
--
 assantos - 2016-03-18
Comments
Clearly BM3, BM4 and BM5 are completely out of reach. I think that the next obvious steps would be to do the limits on BM1 and BM2 in a more precise way, using PYTHIA+DELPHES for better signal modelling.
--
trtomei - 2016-04-29
I have changed the cuts that are to be applied to the analysis to take into account the showering / hadronization effects.
--
trtomei - 2016-05-17
I have included information about new i2HDM production (8 and 13 TeV) in the table.
--
assantos - 2016-05-18


